
Note: This post is a revised version of a paper I submitted as an assignment for an “Introduction to Social Data Science” module, near the start of my Master’s degree, almost a year ago (in December 2023). The final version of the paper was geared towards fulfilling the assignment’s requirements besides being shortened to meet the word count. While the analysis is basic with many limitations and flaws, it is a useful primer / conversation starter / entry point. Plus, since I made the effort in producing it, I might as well share it here. Credit and thanks are due to the Malaysian NGO Tindak Malaysia for collating and making public the general election datasets. If you’re interested, my original paper has the full list of references/sources and can be downloaded here. While this post needs further editing and refinement, it has been stuck as a draft for months. So in the spirit of getting things shipped, here it is.
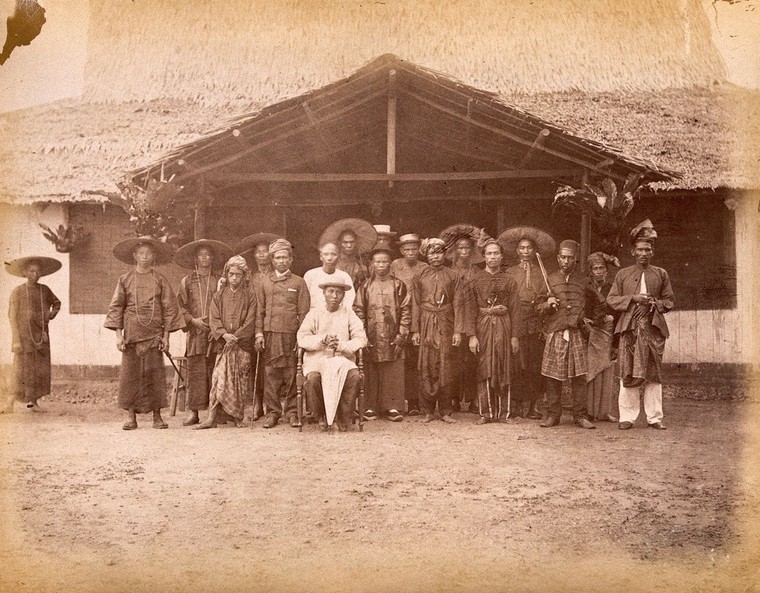
“Racial harmony” or “the enemy of my enemy is my friend”. I have come across two different captions for this photograph. The first is from the official source, the Wellcome Collection: “Malaya: Captain China surrounded by his Chinese and Malay followers. Photograph by J. Taylor, 1880.” The second is from the 2017 Jalan Merdeka exhibition held at Carcosa Seri Negara: “The Chinese Kapitan of Hai San Secret Society and his fighting men at Klang (1874)”. Image source: Wellcome Collection.
Can machine learning predict the winner of an election?
Can machine learning (ML) predict the winner of an election? We explored this research question in two parts. First, we investigated whether demographic and socioeconomic factors can help predict/identify the winning political coalition for a constituency at the federal parliamentary level in the 15th Malaysian General Elections (GE15) held in 2022. Second, we identified which demographic and socioeconomic characteristics were the most important predictors.
This analysis is important as it contributes towards a data-driven discourse on Malaysian voters and election outcomes. This would inform not just political strategy but also policymaking in the widest sense, as it may impact how government, the private sector, and the third sector understand and attempt to influence these factors.
While there is ongoing debate about which factors are important predictors, there is only a limited number of empirical studies that have been conducted. There is a risk that countries with first-past-the-post electoral systems and political parties that rely on ethnic-based support can have highly skewed election outcomes where ethnicity becomes the primary determining factor.
Additionally, research on the new political phenomenon of multi-coalition politics in Malaysia is limited. GE15 was the first general election to witness multiple coalitions contesting, resulting in three coalitions dominating Peninsula Malaysia.
The story thus far
Malaysia is a plural multiethnic and multireligious society. The majority Bumiputera group is mostly Muslim, consisting of ethnic Malays and other indigenous groups while ethnic minorities include Chinese and Indian Malaysians.
Malaysia practices a first-past-the-post voting system where the candidate with the most number of votes is declared the winner, regardless of percentage of votes won. Since gaining independence from Britain in 1957, Malaysia had been governed by a single ruling coalition, i.e., the Barisan Nasional (National Front, BN) until 2018. This was a relatively stable period of 61 years. In the 14th General Elections held in 2018 (GE14), BN was defeated for the first time by the Pakatan Harapan (Alliance of Hope, PH) coalition. Post-GE14, there was a period of political instability which saw three different Prime Ministers and a major reshuffle of the political landscape.
In the 15th Malaysian General Elections (GE15), held in 2022, while no single coalition managed to win a parliamentary majority, PH eventually formed the government with their rivals, BN, against the Perikatan Nasional (Nasional Alliance, PN) coalition.

Many Malaysians were confused by the political reshuffles, post-GE14 (Screengrab from Monty Python’s “Life of Brian”).
What we talk about when we talk about how Malaysians vote
In 2018, Andrés Rodríguez-Pose highlighted how territorial inequality has led to “places that don’t matter”, i.e., areas experiencing “persistent poverty, economic decay, and lack of opportunities”. He argued that poor or declining areas were rebelling against being “left behind” and were revolting at the ballot-box, leading to electoral outcomes like the UK Brexit vote and the US presidential election of Donald Trump.
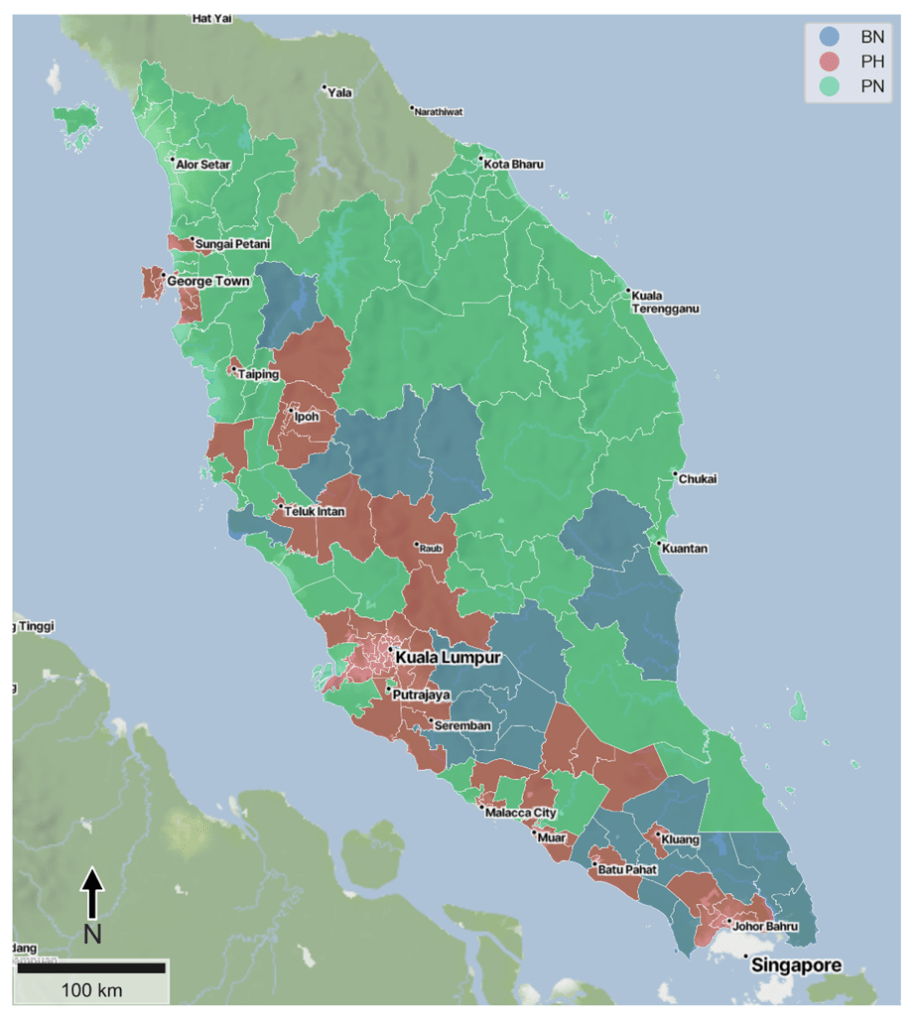
For Malaysia, Rodríguez-Pose’s observations offer insights into the “green wave” narrative that favoured PN in GE15. Seats won by PN are traditionally rural Malay-Muslim and are perceived as “left behind”, as defined by Rodríguez-Pose, concentrated in northern and eastern Peninsula Malaysia (Exhibit 1). Generally, BN and PN use “ethnoreligious branding” to appeal to a Malay-Muslim identity while PH is perceived as more ethnically diverse, winning mixed urban seats along the west coast of Peninsula Malaysia. Besides ethnicity and religion, other factors such as the level of trust in government may have led to the electoral shift in Malaysian “places that don’t matter”.
Recent empirical studies have identified urbanisation and ethnicity as important Malaysian election predictors. Other predictors studied include economic growth, inequality, life satisfaction, and trust in government. However, there is no consensus on which variables are more important. For example, using GE14 data, the same group of researchers found contradictory results in two separate studies. One of these studies found ethnicity to be more significant while the other stated that urbanisation was more important.
Exhibit 1: Peninsula Malaysia parliamentary constituencies by winning coalition in GE2015.
What we did
The overall methodology and workflow is summarised in Exhibit 2. The analysis focused only on the 165 seats in Peninsula (West) Malaysia, excluding the 57 East Malaysian constituencies of Sabah and Sarawak on the island of Borneo. Our approach aligns with past studies excluding East Malaysian states which have distinct policies and demographics, and are relatively insulated from Peninsular Malaysian politics.
Exhibit 2: Overall study workflow
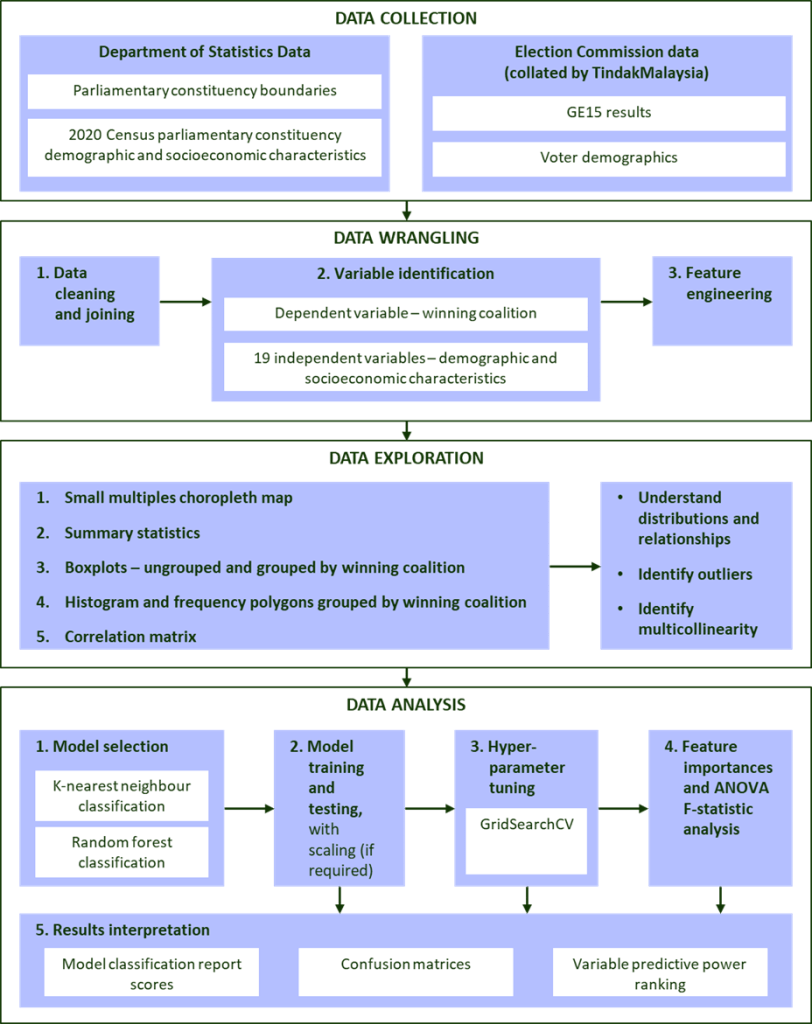
We compiled datasets including from the Department of Statistics, Malaysia (DOSM) and GE15 results and voter demographics from the Election Commission, obtained from Tindak Malaysia, a Malaysian NGO. The dependent/target variable investigated was the winning coalition for a constituency. Demographic and socioeconomic independent/predictor variables were identified from past studies. It should be noted that both voter demographic data from the Election Commission and census demographic data from DOSM were investigated because voters may not vote where they live due to high levels of internal migration.
Our study aimed to predict the winning coalition using a set of 19 constituency independent variables such as population density and household demographics. We chose two basic but proven supervised ML methods, i.e., K-nearest neighbours (KNN) classification and random forests (RF). KNN is a good baseline for small datasets while RF which is made up of multiple decision trees is more robust than a single decision tree and does not require data scaling.
We tested four different models (in Python using scikit-learn) to see how well they could predict outcomes – a basic version of RF and KNN and improved versions that were fine-tuned using several different settings to find the best combination. The dataset was randomly divided into training data (70%) and test data (30%) and scaled appropriately to avoid data leakage (which could cause data bias and affect accuracy).
What we found
We visualised the independent variables in multiple ways, some of which are shown below. These include spatial visualisation using a small multiples choropleth map (Exhibit 3) as well as boxplots (Exhibit 4) and frequency polygons (Exhibit 5) that were both categorised by winning coalition to compare the different variable distributions by coalition.
Exhibit 3: Choropleth maps of independent variables investigated.
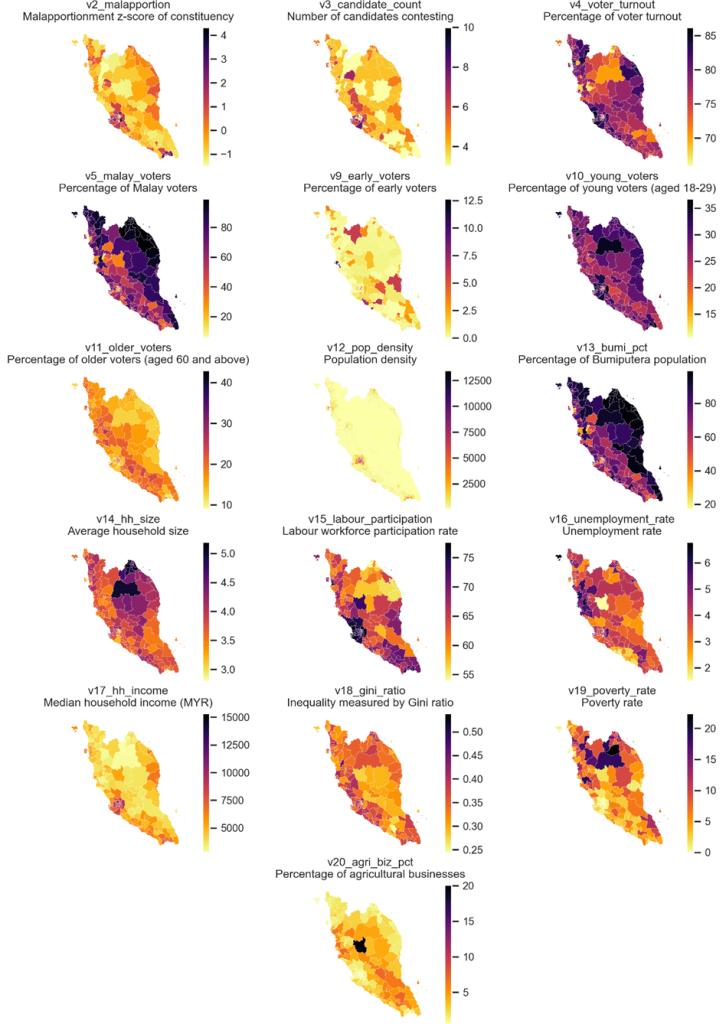
Exhibit 4: Boxplots of independent variables investigated, grouped by winning coalition.
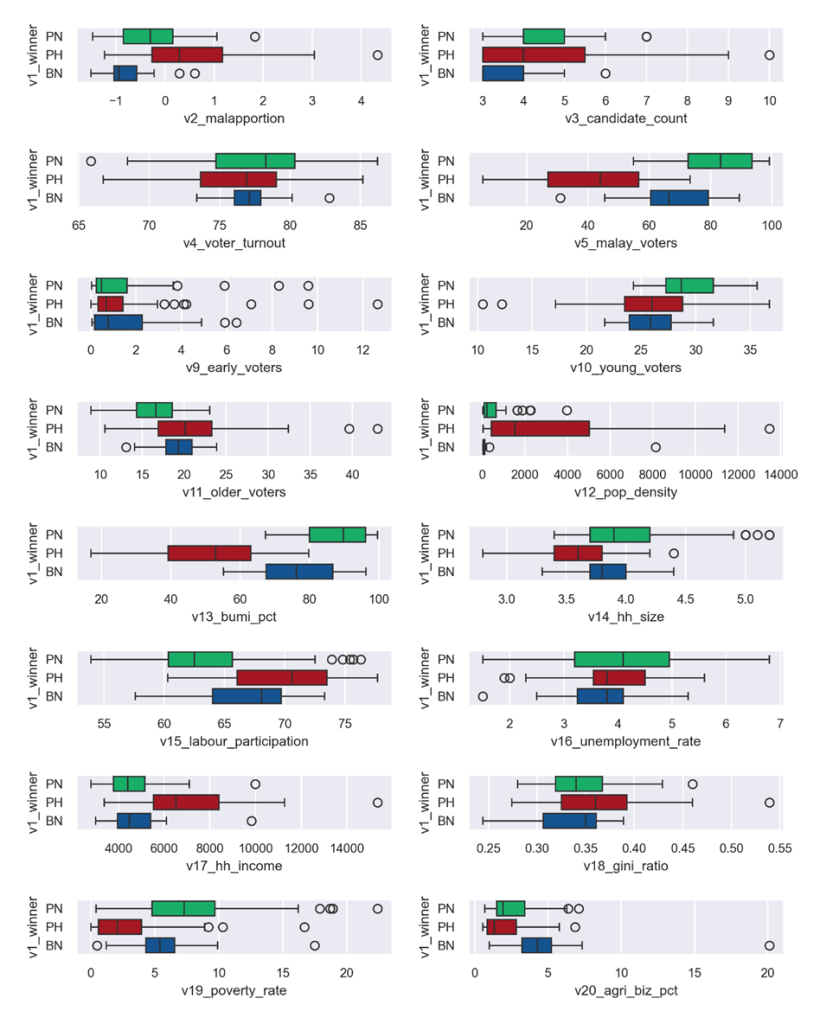
Exhibit 5: Frequency polygons of independent variables investigated, grouped by winning coalition.
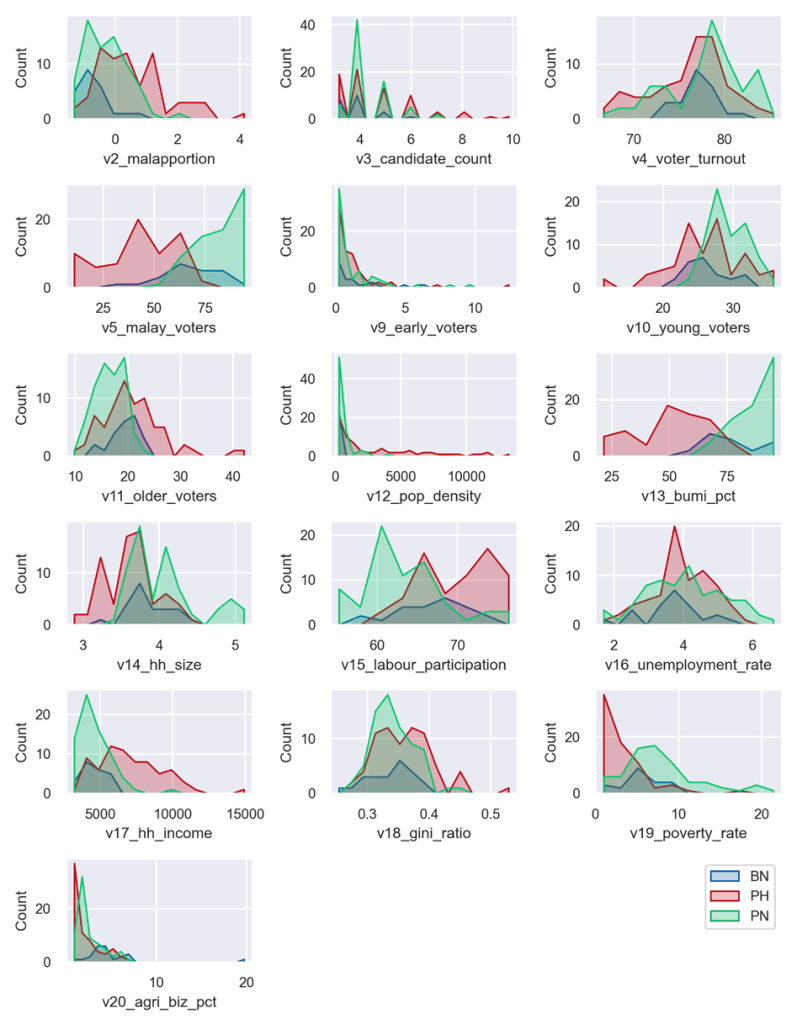
From these visualisations, there were several interesting observations that align with existing literature. PH constituencies were urban, wealthier, and had higher proportions of ethnic minorities (i.e., less Malay/Bumiputera). PN constituencies generally were the opposite of PN constituencies, more rural, less wealthy, and with higher Malay/Bumiputera populations, and also had younger voters. Meanwhile BN constituencies generally had characteristics that were between PH and PN.
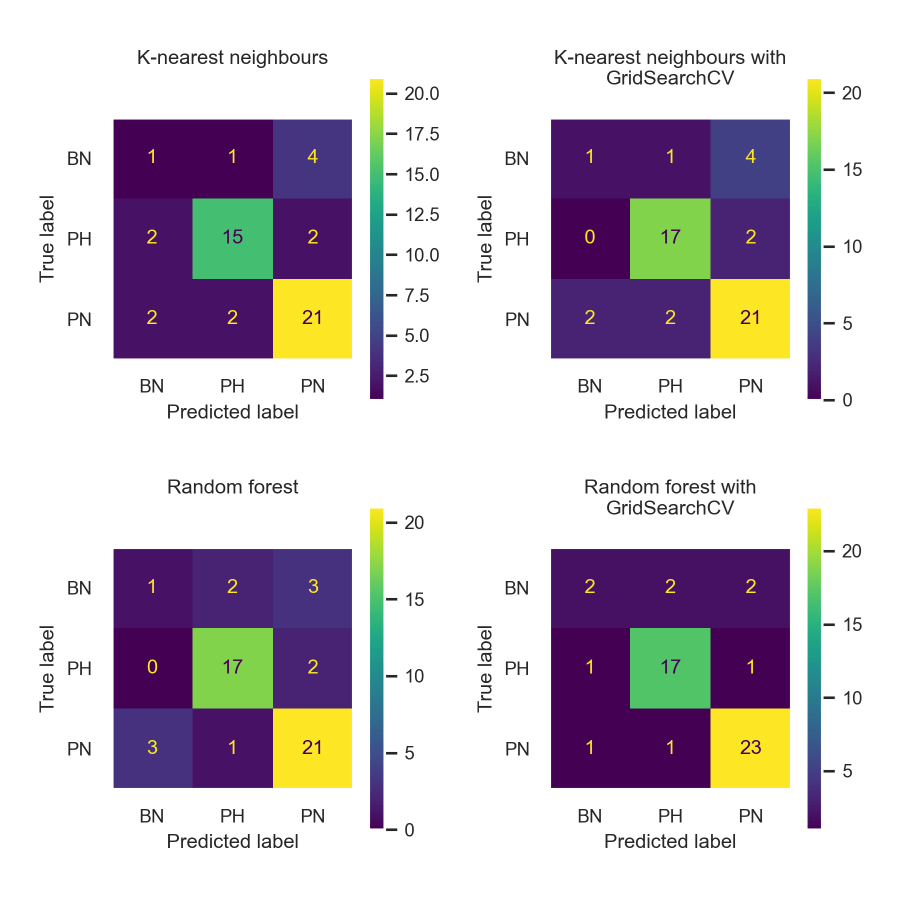
The randomly selected test data subset had 50 samples consisting of BN (6), PH (19), and PN (25). BN constituencies were only 13% of the total dataset. Imbalanced data is a limitation that may reduce the robustness of the results.
Exhibit 6 summarises the results for all models. Overall, the random forest models performed better than the KNN models, with higher accuracy and F1-scores, while the improved versions outperformed the baseline models.
Exhibit 6: Summary of ML model results in predicting the winning coalition.
| Model | Accuracy | Macro average F1-score | Weighted average F1-score |
| Baseline KNN | 0.74 | 0.60 | 0.73 |
| Improved KNN (with GridSearch CV) | 0.78 | 0.63 | 0.76 |
| Baseline random forest | 0.82 | 0.72 | 0.81 |
| Improved random forest ((with GridSearch CV) | 0.84 | 0.72 | 0.83 |
The accuracy metric measures the overall correctness of predictions while the F1-score balances precision and recall scores. Macro average treats all classes equally while weighted average only accounts for the number of instances in each class. In this study, the macro average F1-score is particularly important because the model’s use would be limited if it could only accurately predict the outcome of one coalition, highlighting the need for balanced predictive performance across all classes.
The confusion matrices (Exhibit 7) indicate how well each model predicted the winner by class (i.e., coalition). All models had fairly good predictive powers for identifying PH and PN, but BN prediction was poor, with only a 33% true positive rate at best.
Exhibit 7: Confusion matrices for the different models.
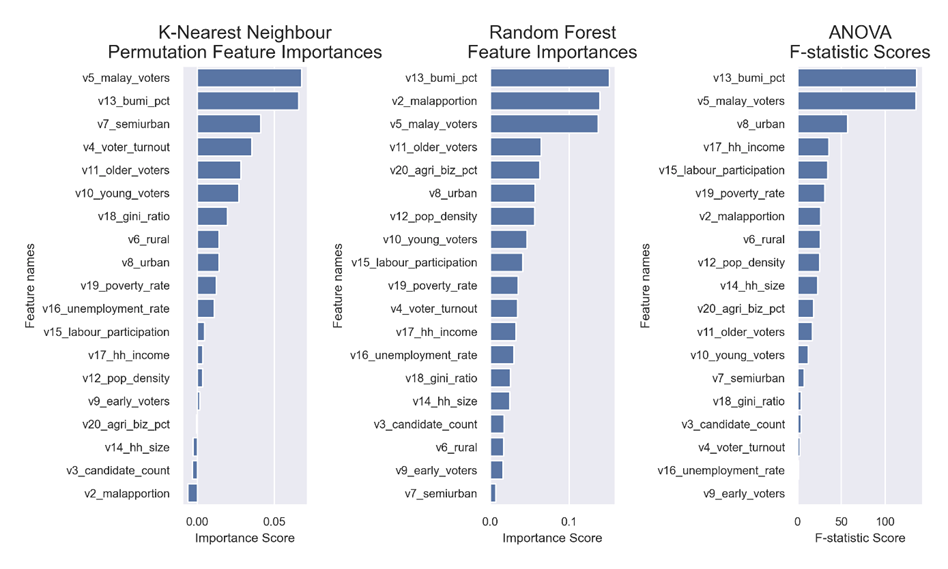
To identify which variables had higher predictive power, KNN permutation feature importances, RF feature importances, and ANOVA F-statistic scores were calculated (Exhibit 8). Without getting into technicalities, these metrics measure which features have the most significant impact on predicting the outcome.
Exhibit 8: Ranking of variables by predictive power using different metrics.
Does electoral history rhyme or repeat?
We evaluated whether KNN and RF classification could predict Malaysian parliamentary constituency winners using demographic and socioeconomic variables. The models showed good accuracy overall, but their performance in predicting BN wins was weak, as indicated by the lower macro average F1-scores and the confusion matrices.
Feature importances and ANOVA analyses identified key predictors. Ethnicity and urbanisation variables were top predictors, with ethnicity consistently outranking urbanisation. Other important indicators that appear in the top five ranking for the feature importances and ANOVA results include malapportionment, household income, percentage of young and old voters, voter turnout, labour participation rates, and percentage of agricultural businesses.
Interestingly, household income, labour participation rates, and percentage of agricultural businesses are potential indicators of territorial inequality. Further research in identifying the voting patterns of “left-behind-places” and levels of trust in government may yield new insights and provide a plausible nuanced counternarrative to the traditional narrow lens of ethnic and religious identity politics in Malaysia.
This study had several limitations. First, the dataset was small and imbalanced (i.e., there were more PH and PN constituencies than BN), leading to models useful for predicting PH and PN wins but with low predictive power for BN.
Second, the ML methods have individual weaknesses. KNN is sensitive to scaling and class imbalances while RF results are not easily interpretable. Future exploration could consider alternative methods and further model tuning (hyperparameter tuning) to address model over/underfitting.
Third, feature engineering methods could be used to reduce the number of variables, e.g., using Principal Component Analysis.
What would be interesting would be conducting longitudinal analysis by including results in earlier elections to understand trends across time. The spatial dimension could also be included to understand how regional and local factors affect voting outcomes. We could also reframe the study so that the target variable is changed from a category/class (i.e., winning coalition) to a continuous variable (e.g., winning margin, share of votes won). This would mean that the ML problem becomes a regression problem instead of a classification problem.
Finally, one obvious recommendation would be to examine voting patterns using more granular data at a lower aggregation level which may yield different insights. However, this data isn’t publicly available, to my knowledge.
In conclusion, this study demonstrated the potential use of ML methods in predicting election winners. The results show that ethnicity remains a more influential election predictor than urbanisation. However, it is also important to remember that past election results are not necessarily a predictor of future performance. Electoral history doesn’t necessarily repeat, but perhaps it may rhyme.
References:
Chacko, D.P. (2023) ‘joelgohtzewen/TindakMalaysia-GE15-Dataset: TindakMalaysia GE15 Data (forked 2023_12_24)’. Zenodo. Available at: https://doi.org/10.5281/zenodo.10429575.
Chin, J. (2023) ‘Anwar’s long walk to power: the 2022 Malaysian general elections’, The Round Table, 112(1), pp. 1–13. Available at: https://doi.org/10.1080/00358533.2023.2165303.
Department of Statistics, Malaysia (2023) ‘joelgohtzewen/dosm-data-open: DOSM Open Data (forked 2023_12_24)’. Zenodo. Available at: https://doi.org/10.5281/zenodo.10429554.
Dettman, S. and Pepinsky, T.B. (2023) ‘Demographic structure and voting behaviour during democratization: evidence from Malaysia’s 2022 election’, Democratization, 0(0), pp. 1–22. Available at: https://doi.org/10.1080/13510347.2023.2254707.
Jaidka, K. et al. (2019) ‘Predicting elections from social media: a three-country, three-method comparative study’, Asian Journal of Communication, 29(3), pp. 252–273. Available at: https://doi.org/10.1080/01292986.2018.1453849.
Lee, C. (2019) ‘Economic Voting and the End of Dominant Party Rule in Malaysia’, in F.E. Hutchinson and H.A. Lee (eds) The Defeat of Barisan Nasional: Missed signs or late surge? Singapore: ISEAS Publishing, pp. 113–130. Available at: https://doi.org/10.1355/9789814843904-011.
Müller, A.C. and Guido, S. (2016) Introduction to machine learning with Python: a guide for data scientists. First edition. Sebastopol, CA: O’Reilly Media, Inc.
Ng, J.W.J. et al. (2022) ‘Life Satisfaction and Incumbent Voting: Examining the Mediating Effect of Trust in Government’, Journal of Happiness Studies, 23(6), pp. 2947–2967. Available at: https://doi.org/10.1007/s10902-022-00536-z.
Ng, J.W.J., Rangel, G.J. and Chin, E.P.Y. (2021) ‘Did Urbanization or Ethnicity Matter More in Malaysia’s 14th General Election?’, Contemporary Southeast Asia, 43(3), pp. 461–495. Available at: https://doi.org/10.1355/cs43-3b.
Ng, J.W.J., Rangel, G.J. and Phung, Y.C. (2021) ‘Malaysia’s 14th General Election: dissecting the “Malaysian tsunami”—measuring the impacts of ethnicity and urban development on electoral outcomes’, Asian Journal of Political Science, 29(1), pp. 42–66. Available at: https://doi.org/10.1080/02185377.2020.1814363.
Ong, E. (2020) ‘Urban versus Rural Voters in Malaysia: More Similarities than Differences’, Contemporary Southeast Asia, 42(1), pp. 28–57. Available at: https://doi.org/10.1355/cs42-1b.
Ostwald, K. and Oliver, S. (2023) Continuity and Change: The Limits of Malaysia’s Green Wave from a Four Arenas Perspective. 87. Singapore: ISEAS Yusof Ishak Institute.
Ostwald, K. and Subhan, M.S. (2021) ‘Regional identity formation in Malaysia: Primacy of the political center and its essentialized ethnic identities’, Asian Politics & Policy, 13(1), pp. 37–55. Available at: https://doi.org/10.1111/aspp.12565.
Rodríguez-Pose, A. (2018) ‘The revenge of the places that don’t matter (and what to do about it)’, Cambridge Journal of Regions, Economy and Society, 11(1), pp. 189–209. Available at: https://doi.org/10.1093/cjres/rsx024.
Welsh, B. (2013) ‘Malaysia’s Elections: A Step Backward’, Journal of Democracy, 24(4), pp. 136–150. Available at: https://doi.org/10.1353/jod.2013.0066.
